
Drometra

Smart city

The fleet movements, added and anonymous, to plan the city.

The fleets that work in your city know where they stop to download, which streets are filled with taco and at what time. Drometra brings together these combined and anonymous movements to plan cargo areas, paradoxers and schedules.

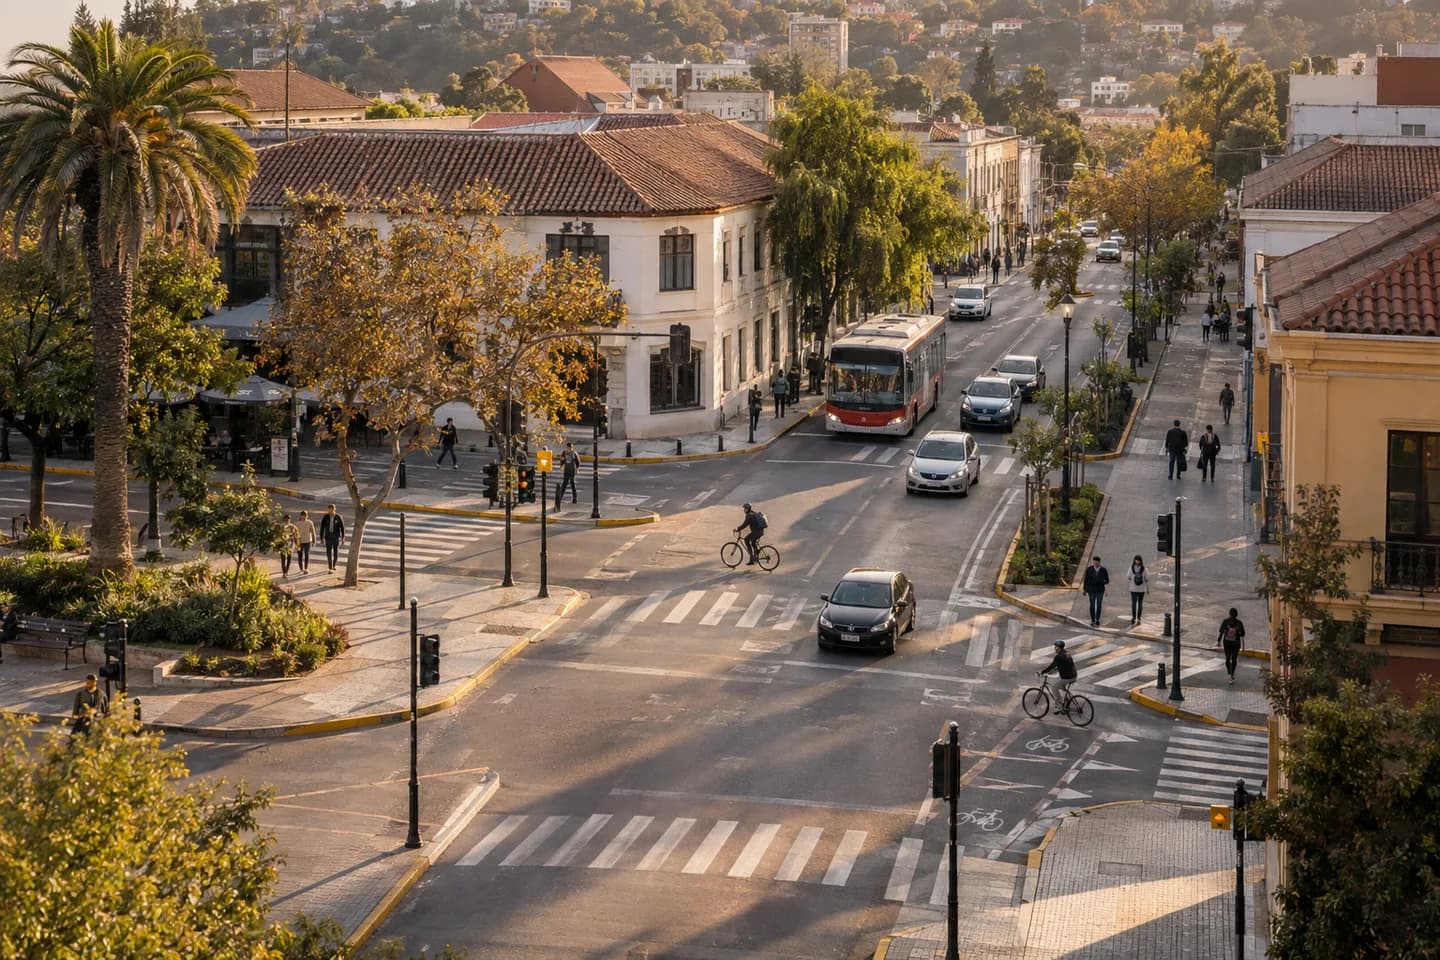
Illustrative scene of smart city created for Drometra.

Three problems we know by memory

That the city decides where a cargo area, a whereabouts or a change of meaning is going with the actual movement of the fleets that travel it, and that a person never appears in that data.

The cargo areas were painted where someone claimed

There is an empty cargo area all morning and, two blocks further, three double-row trucks in front of the supermarket.

The added map of Drometra shows where the cargo vehicles are actually stopped, how long and at what time, it is square by block. Transit proposes the area where the demand is, not where the claim came.

What we left set up
We define with you the block grid, the time slots, and what counts as a cargo arrest.
What you got next
A demand map of loading and unloading per block and per hour.

Everyone knows the avenue is swallowing, no one knows from what time

The last transit study was done on a Tuesday two years ago, with a manual count. Since then, it has opened a small and two lines of micro changed its course.

Drometra calculates the speed of the aggregate fleets by section and time strip, week after week. The planning team sees which section and at what time the speed begins to fall.

What we left set up
We connect the agreement fleets and set the sections and periods to be compared with your team.
What you got next
Velocities per section and time that are updated each week, not each study.

The microns stop where people come down, not where the whereabouts are.

The buses on a line stop at a corner without a whereabouts in front of the hospital, and the official whereabouts, half a block away, are almost unused.

With the data shared by bus operators, Drometra shows where they stop out of their whereabouts, how long and when. The proposal to move or add a whereabouts to some of these arrests.

What we left set up
We charge the location of the current paradoxers to separate the planned arrests from those that are not.
What you got next
A list of corner candidates for whereabouts, ordered by real arrests.

A Tuesday in the center, seen block by block

Between nine and eleven, the delivery trucks stop over and over again in the same block, which has no loading area. The transit address sees it as a dark cell on the added map, without patents or drivers, and proposes the area in the next corner.

  1. contributing fleets

    Only the movements of the fleets that sign the agreement, without patents or driver names, enter.

  2. Tables and strips

    Drometra groups arrests and speeds per block and per hour, and hides cells with few vehicles.

  3. Urban decision

    Planning compares the before and after moving a cargo area or a whereabouts.

Maipu Street, from nine to eleven: the missing cargo area

  1. What happens

    The merchants of a block of Maipu claim for the double row, and the fines do not change anything. The nearest cargo area is two blocks away.

  2. What the team does

    Transit opens the added map: between nine and eleven that block concentrates the cargo arrests of the sector, almost all short. It is proposed a cargo area with schedule on the same block.

  3. How it ends

    Months later, the same map shows the arrests within the new area. The decision is supported by data that does not identify any truck or driver.

Questions you'll be able to answer

Every answer comes out of what your team already records at work. No one has to set up a spreadsheet for that.

Where and at what time is the load and discharge concentrated?

Detentions of load vehicles grouped by block and time strip, with their average duration and the quantity of different vehicles.

Locate loading areas with schedule where the demand is and release the ones that no one uses.

What sections does the speed fall and from what time?

Average speed per section and time strip of the convention's fleets, compared week by week.

Priorities traffic lights, control or sense changes with the exact stretch and time.

The change we made moved something in the street?

The same measurement before and after the intervention, in the same block, strip and type of day.

You decide if you extend the change to other blocks or you return it to the way it was.

Your first weeks with Drometra

  1. Day 1: We define with your team the planning questions, the block grid and the time slots.
  2. Week 1: we connect the municipal fleet and those of the agreement, with the minimum of vehicles per cell agreed.
  3. Week 2: We deliver the first added map of load and speeds, with the hidden cells marked.
  4. Month 1: The weekly series comes to your GIS by the Data Connector and we measure the first intervention.

What they ask us in smart city

Preguntas frecuentes

Let's talk about smart city

We start from a tour, a task or a turn of your operation. That's the best place to find the next step.